Dear Members,
We are pleased to share the results from the last two Semi-Annual Membership Satisfaction Surveys, covering January–June 2025 and July–December 2025.
During 2025, we launched our first-ever semi-annual feedback survey with a clear goal: to gather meaningful, actionable information that helps us continuously improve your overall membership experience. Your responses provide us with valuable insight into what we are doing well and where we can be better.
We want you to know that our management team and leadership have carefully reviewed every category, comment, and score. We didn’t just look at numbers; we dug through the responses to identify trends, patterns, and common themes. When making decisions, our focus is always on impacting the greatest number of members while using data-based insights to guide improvements.
Background & Participation Metrics
To help provide context around the survey results, we want to share some high-level background information about the members who participated. This allows us to better understand who is responding and how they use the facility.
Member Demographics
Overall, survey participation reflects a membership that skews older, with the majority of respondents over age 50 and the largest single group being 70+.
Average Handicap
Gender Breakdown
Facility Usage
The most common response indicated 2–4 visits per week
A smaller but notable group reported 5+ visits per week, particularly during peak season
Length of Membership
This data reinforces that the feedback we receive is coming from highly engaged, long-tenured members who regularly use and care deeply about the club.
How We Use Your Feedback
Not every suggestion can be implemented immediately, and not every request impacts the majority of the membership. These surveys help us:
Identify areas that matter most to members
Spot trends that affect the overall experience
Measure progress over time
Make informed, data based decisions rather than assumptions
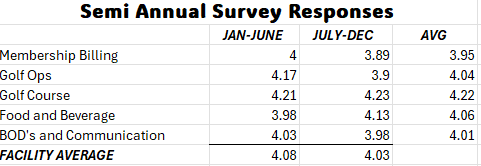
Survey Results Summary
Below is a summary of the average scores from both survey periods (on a 5-point scale):